Continues Integration Performance Testing
Discovering performance problems as early as possible would save you money and time. How about finding them out right after a commit? Changing environment settings? How could you be sure that all 20+ nodes of your application are healthy running your changes? Some manual testing or one thread automated testing simply wouldn’t do it. How about generate some smoke load?
To solve the challenges above and even more, you can add Smoke and Benchmark performance tests to your continues integration workflow. To do so I used:
- Jenkins as a continues integration (CI) agent
- Jmeter for load and performance testing
- Taurus to orchestrate Jmeter in Jenkins
- Blazemeter for tests reporting
Nice part about the tools - they are all free.
Prerequisites
- Configure continues deployment of code to environments.
- Create a Jmeter script to cover your key functionality: add assertions to all requests, parameterise the script with all possible input values (it’s not manual testing, you can literally add all 10K search strings that your customers are using in production), make it real world like with addition of probabilities of each of the request.
Configuring performance test in CI
Now let’s add performance tests to our CI: we want to run smoke load test with a few virtual users after each build and run benchmark test for every release build.
-
Install Taurus. Taurus is an open source tool to configure and run different load/performance test setups. Single Jmeter script can be used to run various types of tests: ramp-up, smoke, benchmark etc. Installation instructions.
-
Create configuration yml files for each of the environment and test type. Check example below.
-
Run test with command:
bzt smoke.yml -
Configure Jenkins job to run test on each builds. Jenkins freestyle project can be used.
Taurus Yml file example for a smoke test (example gist)
#! /usr/local/bin/bzt
 ---
 execution:
   concurrency: 10
   ramp-up: 30s
   hold-for: 5m
   scenario:
     script: Smoke_script.jmx
     properties:
         my-hostname: YOUR_HOST.COM

 reporting:
   - module: blazemeter
     test: Smoke Test
   - module: junit-xml
     filename: report.xml
     data-source: pass-fail
   - module: fail-criteria
     criterias:
     - avg-rt>250ms for 30s, continue as failed
     - failures>5% for 5s, continue as failed
     - failures>50% for 10s, stop as failed
     - rc5??>0 for 10s, continue as failed

 modules:
   blazemeter:
     token: Your Blazemeter Token
     browser-open: false
   console:
     disable: true

 settings:
   check-interval: 5
Sweet part that now you can use one Jmeter script.jmx for all environments and test types: all you need is to change hostname and runtime settings like number of concurrent users in the yml configuration.
Enjoy testing!
Notes
What Taurus is Doing?
When you running Taurus (bzt) it:
- overrides settings in the Jmeter script and creates a new one in the test directory (name will be prompted to the console);
- starts Jmeter in a non-UI mode using the new script;
- disables some of the plugins specified in the script like Loadsophia plugin;
- sends report data to Blazemeter in a real time, so you can analyze and share it on the fly;
Yml Options
Lets walk through some of the options in the yml file:
- execution is mainly used by Taurus to override your script settings in the Jmeter script “Thread group” settings. Settings that are not specified in the section will be taken from Jmeter script.
- properties is custom parameters. In the Jmeter script you can use with property functions:
${__P(my-hostname,YOUR.DEFAULT.HOST.COM)}
More about options in Taurus docs.
Reporting
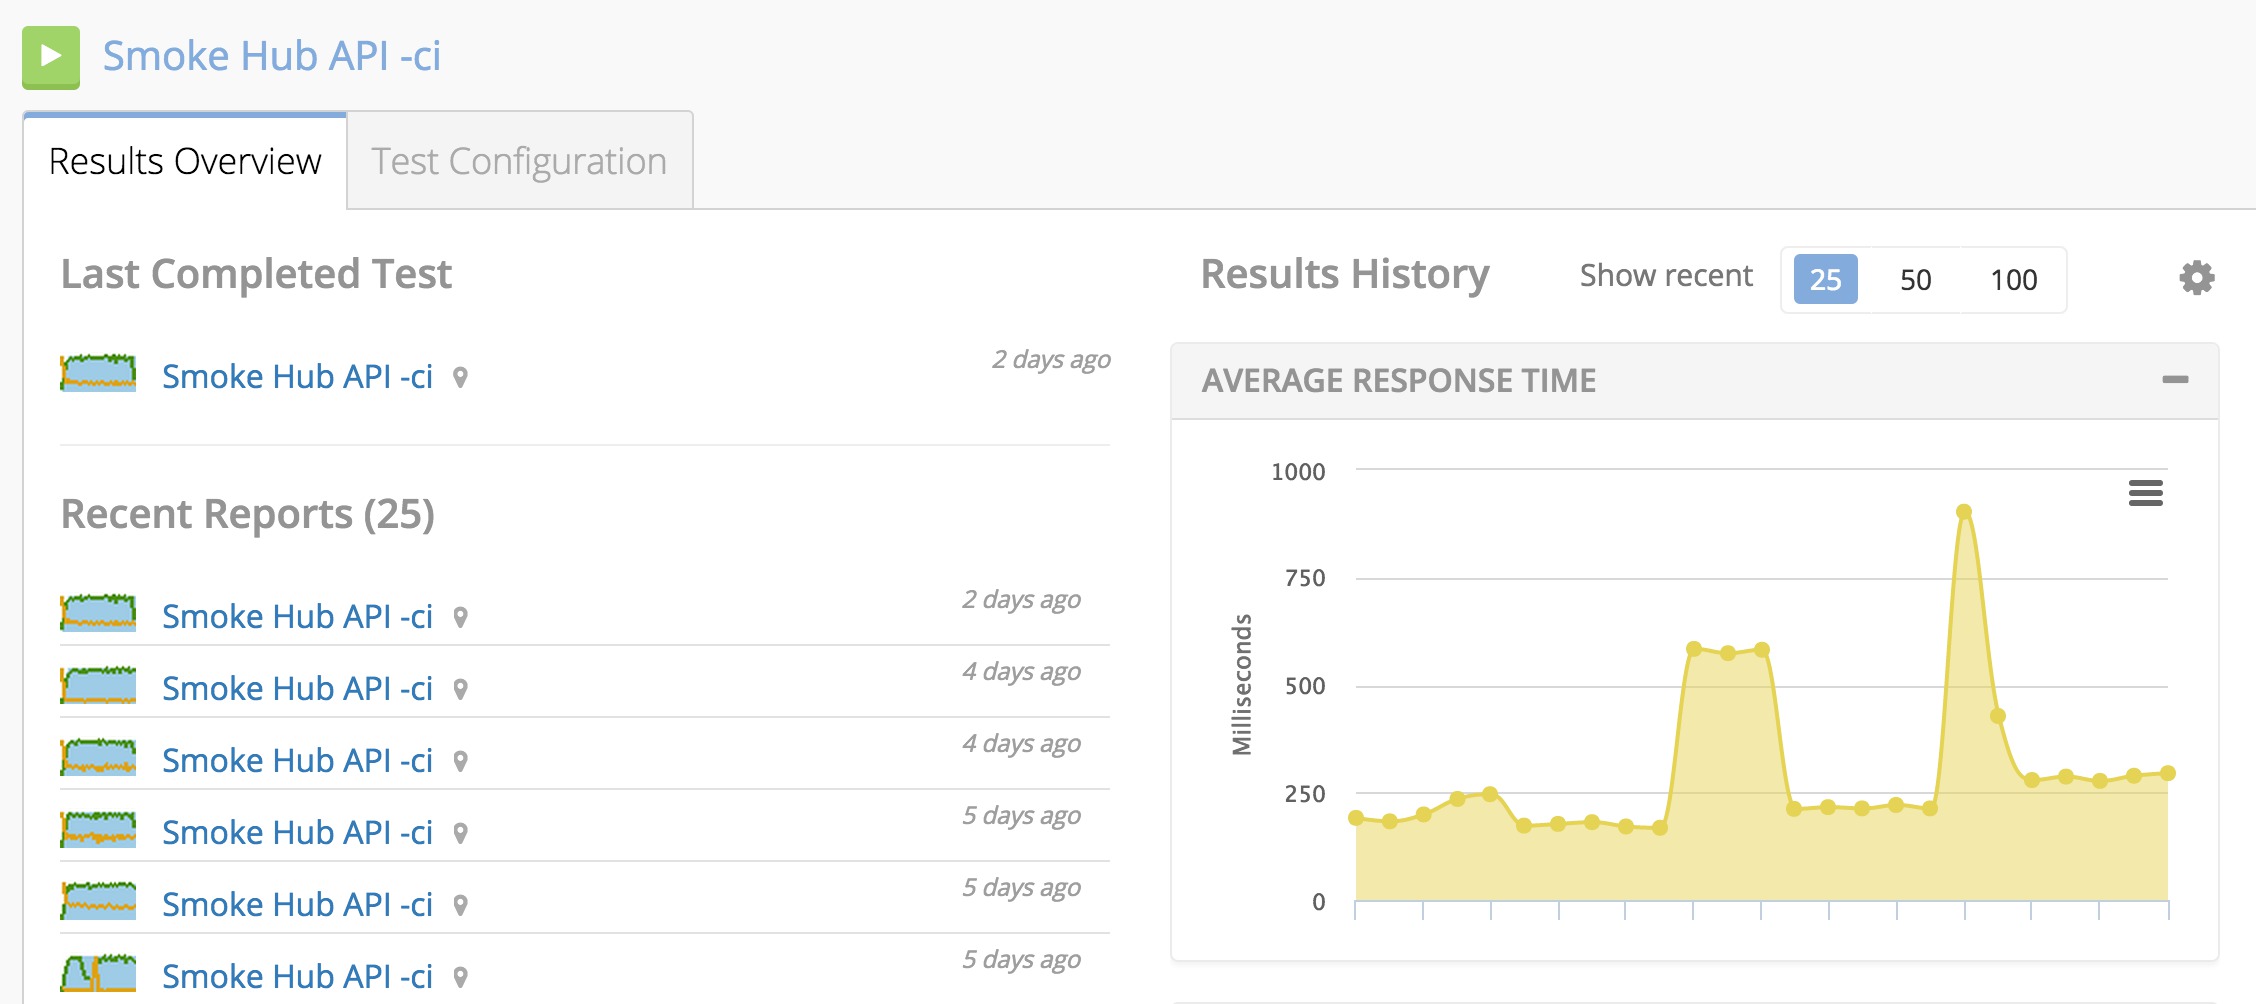
- reporting module blazemeter adds test data to the Blazemeter account reporting specified in the test section. Your API Key can be found under profile settings. You might as well use anonymous reporting, but you will lose the feature I’m enjoying the most: comparison trends for response times, errors and hits/sec for different builds:

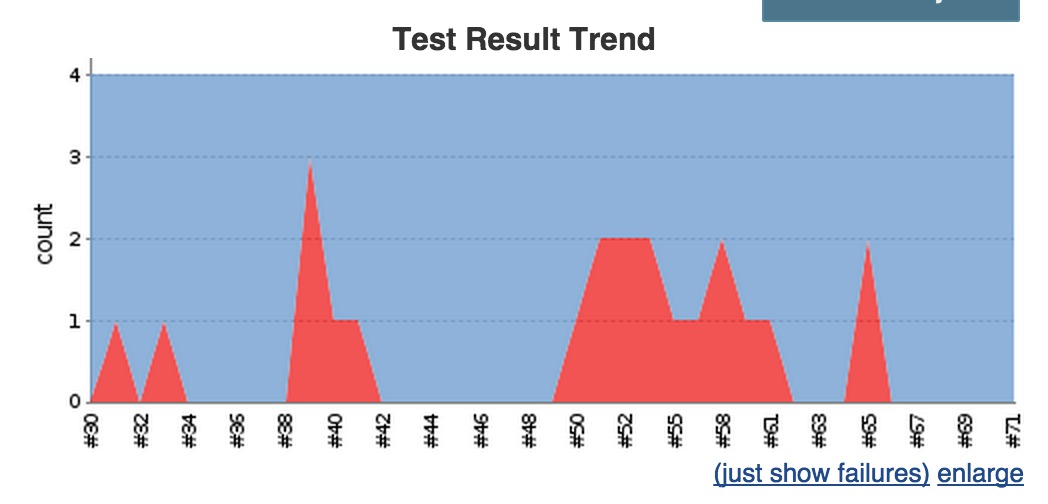
Another nice trend you can configure right in the Jenkins with junit plugin and Taurus module junit-xml to report your criterias status to xml file. Criterias can be specified in Taurus configuration yml, check the config above.

You could do much more with Taurus and Jenkins. Check following Taurus + Jenkins Youtube tutorial.
comments powered by Disqus